“Where is Main Street?” is an interactive map that visualizes travel behaviour by voting record in the Greater Golden Horseshoe.
The concept for this project was inspired by the formerly emblematic “Main Street” of a small town; a place where everyone gathered, viewpoints were shared, and communities were built. In our current very much “online” society, we can sometimes (or often!) get caught into echo chambers of our own pre-existing narratives. For myself, I found this to be the case. So I ask: “Where are all the other people that think differently than me? Where are all those people who vote for that other party?”. Or in other words:
Where is Main Street?
Methodology
Preparing the Origin Destination Data
The Origin-Destination Dataset was downloaded from the results of the 2022 Transportation Tomorrow Survey (TTS). The trip volumes were mapped at the Transportation Assessment Zone (TAZ) level. Additional TTS attribute tables were used to generate the proportional distribution of trips by time of day for each Origin-Destination TAZ pair. This proportional distribution was then applied to the total volume to get an expected volume by time of day.
Preparing the Road Network Data
The road network was taken from the Ontario Road Network from Ontario Open Data. The accompanying “Speed Limit” table was used to derive an approximate travel time across each street segment. For segments without a speed limit, a maximum of 30 km/h was used.
A network analysis was performed to find routes with the shortest travel time between each TAZ pair. The network analysis was performed using pgRouting, an extension for PostGIS/PostgreSQL. For this first iteration, only travel by vehicle was assumed – travel by other modes will be included at a later date.
Preparing the Voting History Data
The voting history by individual poll-by-poll results data was downloaded from Election Canada, and mapped to the Polling Division Boundaries available at Canada Open Data.
The number of votes for each candidate and party were tallied for the polling division boundaries, and then mapped to the TAZ boundaries based on proportional area overlapped. The distribution of votes for each TAZ was then mapped against the total trips by home location to derive a measure for the likely prevalence of travel volume by voting history.
Bringing it together
For each street segment in the road network, all origin-destination trips that passed through it were used to calculate the total number of trips on that segment. Using the distributions for the time of day of the trip and voting history, measures for each these values were calculated.
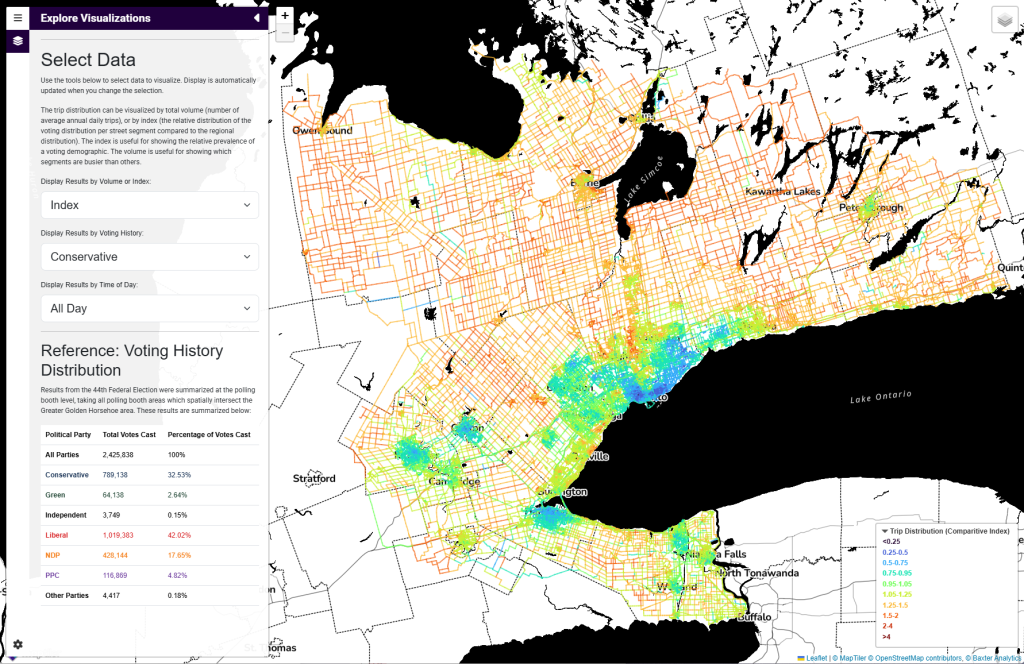
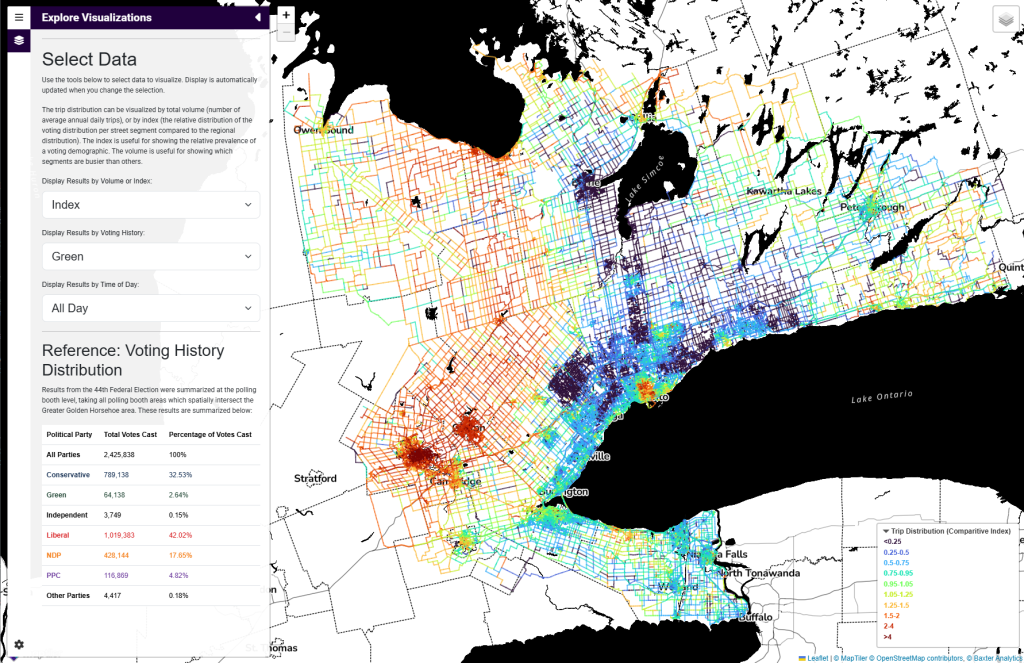
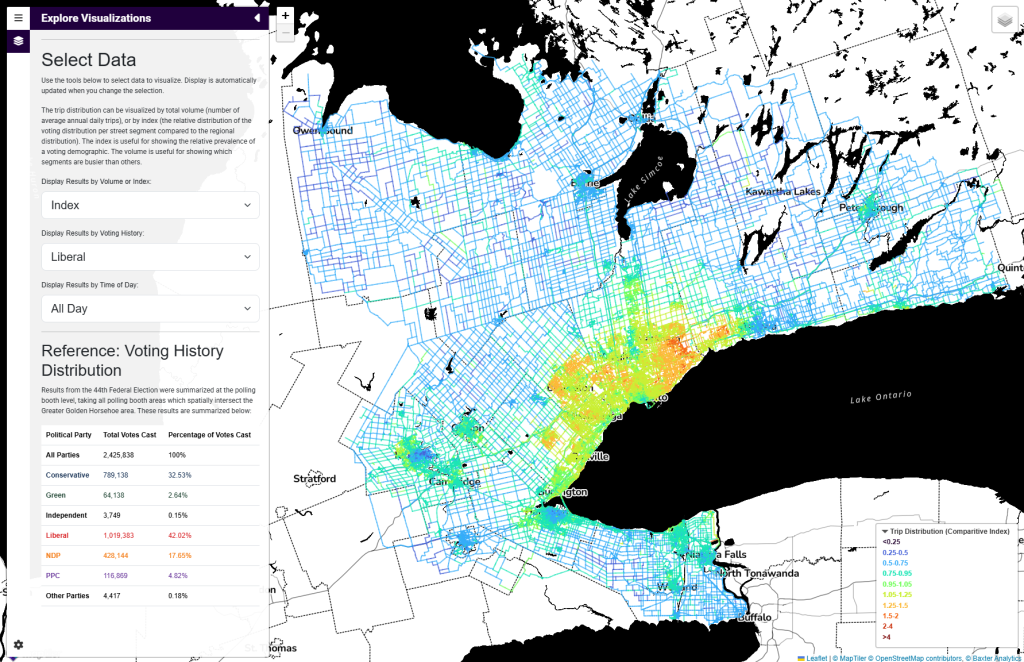
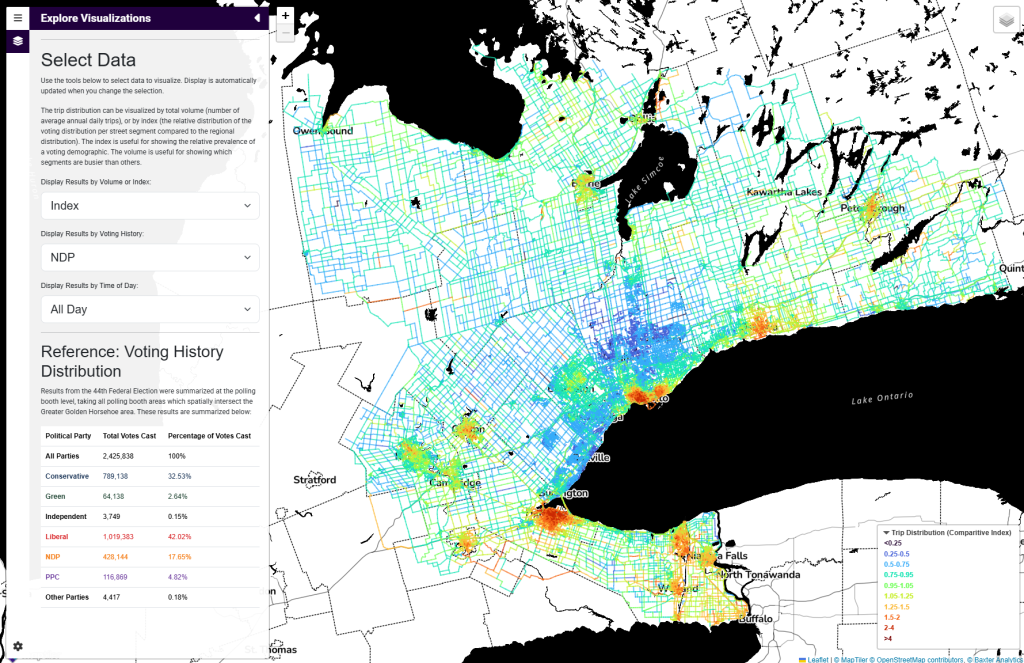
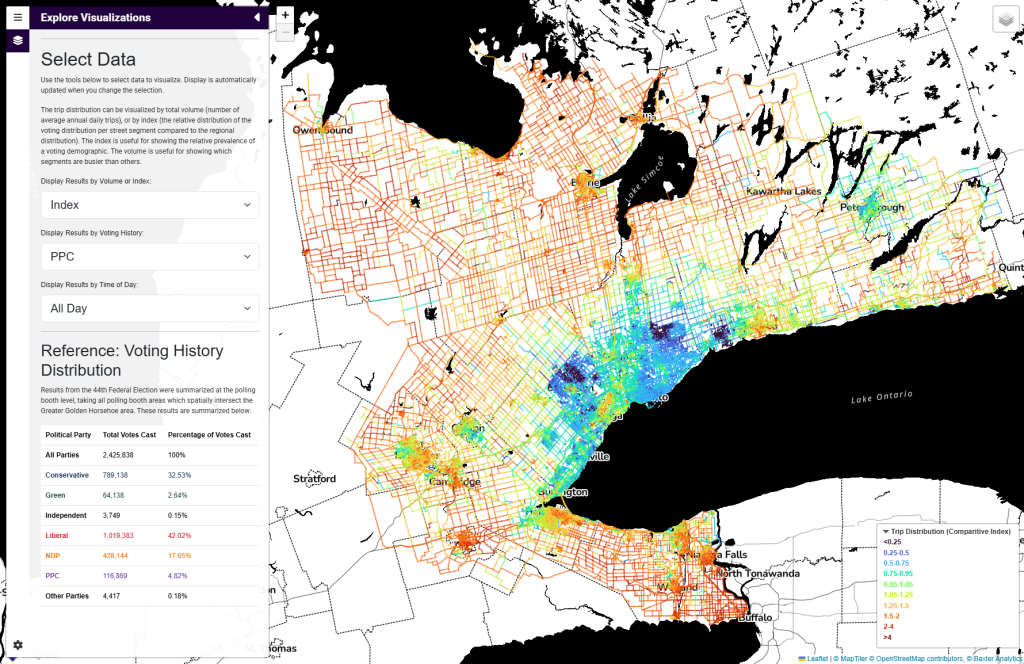
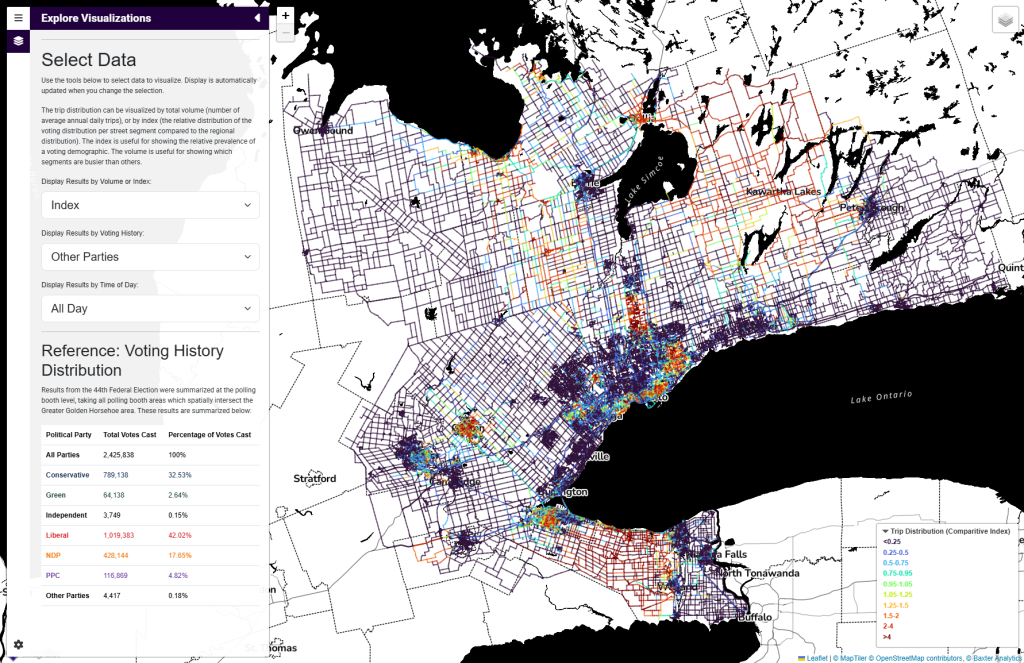
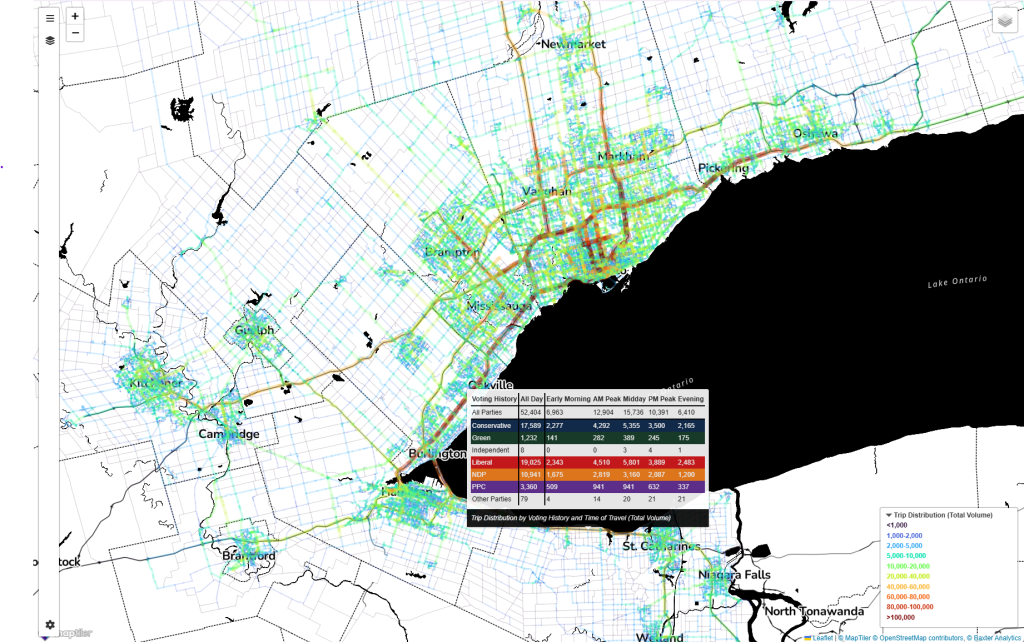
Street segment data was loaded with street segment geometry into a Mapbox Vector Tile (MVT) format and served to the interactive map. The MVT data were generated using the PostGIS MVT functions and Python for handling and organizing the tile development. The interactive map was built using Leaflet.js.
Screenshots from the interactive map